A/B Testing Deployment: Data-Driven Feature Rollouts
A/B testing deployment runs two versions of your app side by side to measure real user impact. See how to set up experiments, read results and decide what ships.

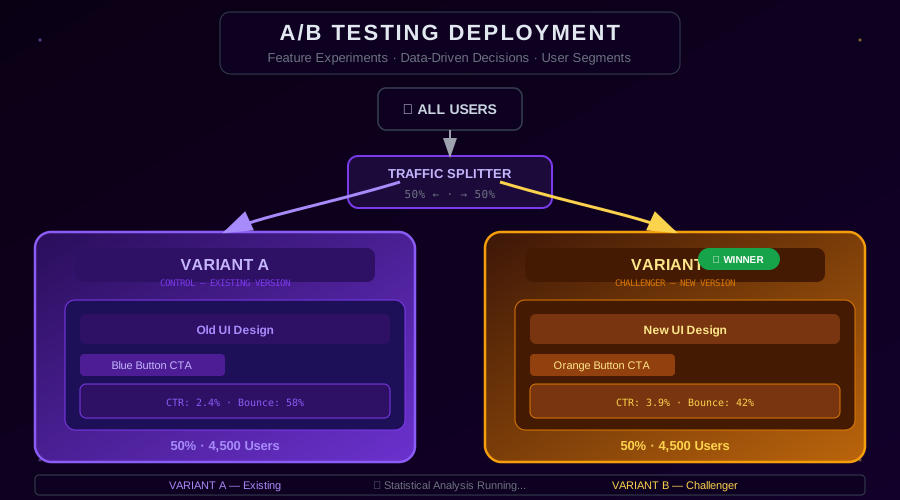
Every time you ship a new feature, you are making a bet. You believe the new design, the new algorithm, or the new user flow will improve your product. But how do you know if you are right? A/B testing deployment answers this question with data rather than assumptions.
A/B testing deployment, also called split testing or experiment-based deployment, runs two versions of your application simultaneously — the original (control) and the new version (variant) — and measures which one performs better against a defined success metric.
What Is A/B Testing Deployment?
Unlike other types of deployment strategies that focus primarily on release safety, A/B testing deployment is about measuring impact. The goal is not just to safely deploy code — it is to generate statistical evidence that a change improves (or does not improve) a specific metric.
Here is how it differs from other strategies:
- Blue-green — Switches all traffic from old to new instantly
- Canary — Gradually shifts traffic from old to new while monitoring for errors
- A/B Testing — Runs both versions simultaneously and compares business outcomes with statistical rigor
The critical difference is that in a true A/B test, both versions run indefinitely until you collect enough data to make a statistically confident decision. It is not about deployment safety — it is about measurement.
The A/B Testing Deployment Flow
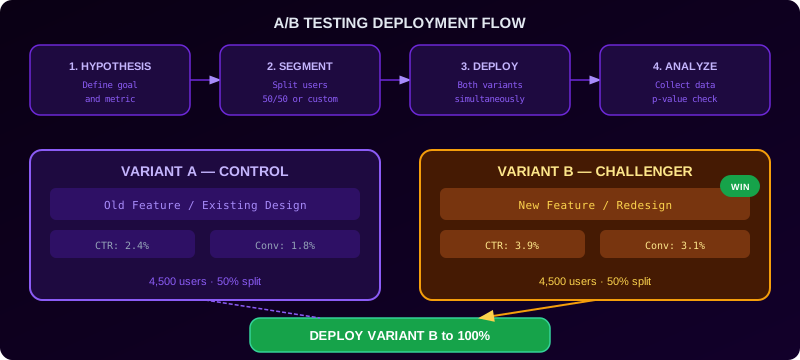
A well-structured A/B testing deployment follows this process.
Step 1: Define Your Hypothesis
Every experiment starts with a clear hypothesis. "If we change the checkout button color to orange, we will increase conversion rate by at least 5% because orange creates more visual urgency than our current blue."
A good hypothesis has three parts: the change, the expected outcome, and the reason.
Step 2: Define Success Metrics
Choose a primary metric and one or two secondary metrics.
- Primary metric: The main business outcome (e.g., conversion rate, sign-ups)
- Secondary metrics: Supporting signals (e.g., time on page, cart abandonment rate)
- Guardrail metrics: Metrics that must not degrade (e.g., error rate, page load time)
Step 3: Calculate Required Sample Size
Before launching the experiment, calculate how many users you need in each group to detect your expected effect size with statistical confidence. Use a sample size calculator with:
- Baseline conversion rate (from production data)
- Minimum detectable effect (the minimum lift you care about)
- Statistical significance level (typically 95%)
- Statistical power (typically 80%)
Step 4: Implement Traffic Splitting
Deploy both versions and configure your traffic splitter to route users to either A or B.
# Istio VirtualService for 50/50 A/B split
apiVersion: networking.istio.io/v1alpha3
kind: VirtualService
metadata:
name: checkout-service
spec:
hosts:
- checkout-service
http:
- match:
- headers:
x-experiment-group:
exact: "b"
route:
- destination:
host: checkout-service-variant-b
- route:
- destination:
host: checkout-service-control
Step 5: Analyze Results
After collecting sufficient data, analyze with statistical rigor. Do not stop the experiment early just because the variant looks better — this is a form of p-hacking that leads to false conclusions.
User Assignment in A/B Testing
Consistent user assignment is critical for valid experiments. The same user must always see the same variant throughout the experiment. The standard approach is to hash the user ID and assign based on the hash.
import hashlib
def assign_variant(user_id: str, experiment_id: str) -> str:
hash_input = f"{user_id}:{experiment_id}"
hash_value = int(hashlib.md5(hash_input.encode()).hexdigest(), 16)
return "B" if hash_value % 100 < 50 else "A"
This approach ensures:
- Consistent assignment (same user always gets same variant)
- Independence between experiments (different experiment IDs produce different assignments)
- No server-side state required
Implementing with Feature Flags
Feature flags are the most common mechanism for A/B testing at the application level. They decouple the deployment of code from the activation of features.
# Using LaunchDarkly SDK
import ldclient
from ldclient.config import Config
ldclient.set_config(Config("YOUR_SDK_KEY"))
client = ldclient.get()
def get_checkout_button_color(user):
variation = client.variation(
"checkout-button-experiment",
{"key": user.id, "email": user.email},
"blue" # default fallback
)
return variation
# In your view/component
button_color = get_checkout_button_color(current_user)
Statistical Analysis
Understanding statistical significance prevents you from shipping a "winner" that actually performs no better than the original.
P-value
Assuming no real difference between A and B, and that the test assumptions hold, p = 0.05 means a 5% probability of a result at least as extreme as the one observed. It does not mean a 5% probability that the result is random. The conventional threshold is p < 0.05.
Confidence Interval
The confidence interval tells you the range within which the true effect size likely falls. A 95% confidence interval of [+2%, +8%] means you can be 95% confident the true lift is between 2% and 8%.
Practical Significance
A result can be statistically significant but practically irrelevant. A 0.1% improvement in conversion rate might be real (p < 0.05) but not worth the complexity of shipping the new feature. Always evaluate whether the effect size justifies the change.
Common A/B Testing Mistakes
Running Multiple Experiments Simultaneously
Running two experiments on the same user journey at the same time creates interaction effects that make it impossible to attribute outcomes to either experiment. Use a single-experiment-per-funnel rule, or use proper multivariate testing methodology.
Stopping Too Early
Looking at results before the experiment is complete and stopping early when you see a winner is called "peeking." It dramatically inflates false positive rates. Run your experiment for the full predetermined duration.
Not Testing the Null Hypothesis
Before every experiment, verify that your control group is healthy. Run an A/A test (two identical groups) periodically to verify your experiment infrastructure is not introducing bias.
Ignoring Novelty Effect
Users sometimes behave differently simply because something is new, not because it is better. This "novelty effect" typically fades after a week. For behavioral metrics, let your experiment run long enough to capture steady-state behavior.
A/B Testing vs Canary Deployment
A/B testing and canary deployment are often confused because both involve running two versions simultaneously.
| Dimension | A/B Testing | Canary |
|---|---|---|
| Primary goal | Measure business impact | Catch production errors |
| Duration | Weeks (until statistical power) | Hours to days |
| Success metric | Business KPIs | Technical metrics |
| Decision basis | Statistical significance | Error/latency thresholds |
| Rollout intent | May not ship variant at all | Always plans to ship to 100% |
You can combine both: use a canary to safely ramp traffic to your variant while simultaneously running your A/B analysis.
Conclusion
A/B testing deployment transforms feature shipping from a leap of faith into an evidence-based process. By running controlled experiments with real users and making decisions based on statistical evidence, you build products that measurably improve over time. The discipline of defining hypotheses, measuring the right metrics, and respecting statistical rigor separates teams that ship with confidence from those that guess.
Related guides: A/B Testing at Scale | Canary Deployment
From the team at Nife
Deploy your next app in minutes, not days.
Nife is a multi-cloud edge platform that lets you deploy, scale, and manage applications globally without the infrastructure headache.