Canary Deployment Monitoring, Metrics and Auto-Rollback
Monitor canary releases with the right metrics and SLOs, then automate rollbacks and progression using Flagger and Argo Rollouts. Config examples included.

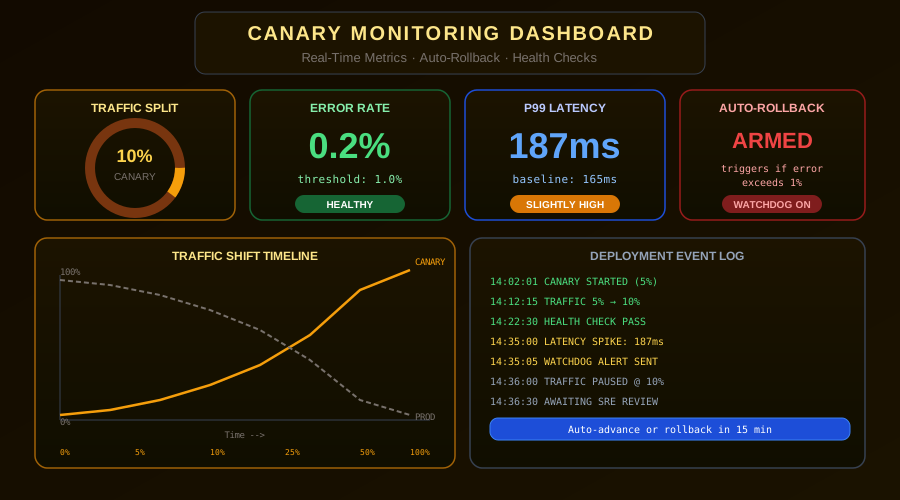
A canary deployment without proper monitoring is just a delayed deployment. The entire value of sending a small percentage of traffic to a new version is the opportunity to observe its behavior in production. Without the right metrics, alerts, and automatic rollback mechanisms, you are flying blind.
The Four Golden Signals for Canary Monitoring
Google's SRE book defines four golden signals that form the foundation of service monitoring. These are especially critical during canary deployments.
Latency — Track both average and tail latency (P95, P99) for canary pods versus production pods. A latency regression is often the first sign of a problem.
Traffic — Monitor the volume and distribution of requests hitting your canary. Unexpected drops can indicate incorrect load balancer configuration.
Errors — Track HTTP error rates (4xx, 5xx) separately from application-level errors. A spike in 5xx errors from the canary is a critical signal to roll back immediately.
Saturation — Monitor CPU, memory, and database connection utilization. Memory leaks build slowly over hours, so use longer lookback windows (1–2 hours).
Setting Rollback Thresholds
Use relative thresholds rather than absolute ones. Instead of "roll back if P99 > 500ms", use "roll back if canary P99 is 20% higher than production P99". This adjusts automatically for time-of-day traffic patterns.
rollback_triggers:
critical:
error_rate_increase: 5x
p99_latency_increase: 50%
warning:
error_rate_increase: 2x
p99_latency_increase: 20%
Prometheus Queries for Canary Comparison
# Compare canary error rate ratio vs production
(
sum(rate(http_requests_total{version="canary",status=~"5.."}[5m]))
/ sum(rate(http_requests_total{version="canary"}[5m]))
)
/
(
sum(rate(http_requests_total{version="production",status=~"5.."}[5m]))
/ sum(rate(http_requests_total{version="production"}[5m]))
)
Automatic Rollback with Flagger
apiVersion: flagger.app/v1beta1
kind: Canary
metadata:
name: my-app
namespace: production
spec:
targetRef:
apiVersion: apps/v1
kind: Deployment
name: my-app
service:
port: 80
targetPort: 8080
analysis:
interval: 2m
threshold: 5
maxWeight: 50
stepWeight: 10
metrics:
- name: request-success-rate
thresholdRange:
min: 99
interval: 2m
- name: request-duration
thresholdRange:
max: 500
interval: 2m
With this configuration, Flagger increases traffic by 10% every 2 minutes, checks metrics at each step, and rolls back automatically if metrics fail 5 consecutive checks.
Automatic Rollback with Argo Rollouts
apiVersion: argoproj.io/v1alpha1
kind: Rollout
metadata:
name: my-app
spec:
replicas: 10
strategy:
canary:
steps:
- setWeight: 10
- pause: {duration: 1h}
- setWeight: 25
- pause: {duration: 2h}
- setWeight: 100
selector:
matchLabels:
app: my-app
template:
metadata:
labels:
app: my-app
spec:
containers:
- name: my-app
image: my-registry/my-app:v2.2.0
Argo Rollouts integrates natively with Argo CD for GitOps workflows, making it ideal for teams with a mature CI/CD pipeline already using that stack.
Canary Alerting Setup
Always alert your on-call engineers when a canary rolls back automatically. Configure Slack and PagerDuty webhooks in Flagger.
webhooks:
- name: slack-notification
type: rollback
url: https://hooks.slack.com/services/YOUR/WEBHOOK
timeout: 10s
metadata:
message: "Canary rollback triggered for {{ .Name }}"
Common Mistakes to Avoid
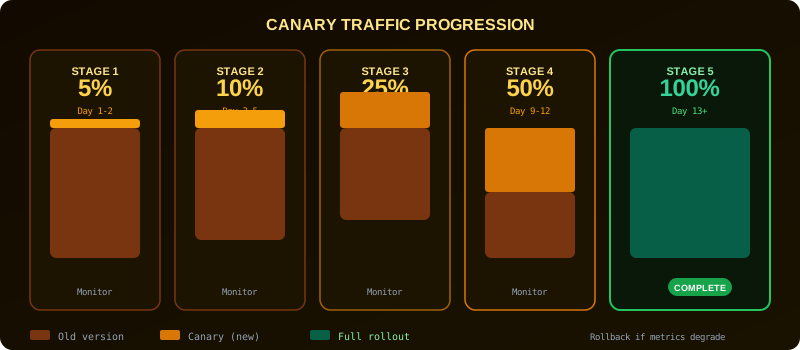
Not waiting long enough at each stage — Use at least 1–4 hours of soak time per stage for important changes. Memory leaks and slow degradations will not appear in a 5-minute window.
Monitoring only error rate — Many degradations appear as latency regressions first. Monitor all four golden signals.
Missing business metrics — A technically healthy canary can still degrade conversion rates or checkout completion. Always track key business metrics alongside technical ones.
No manual override — Always maintain a manual rollback mechanism independent of your automation. During a live incident, waiting for automated checks is not acceptable.
Building a Canary Analysis Report
After every canary deployment, generate a report covering:
- Deployment start and end time
- Traffic percentages at each stage and their duration
- Metric comparisons (canary vs baseline) at each checkpoint
- Any threshold violations detected
- Final outcome: promoted or rolled back
This report builds institutional knowledge and helps calibrate thresholds for future deployments.
Conclusion
A canary deployment system is only as good as its monitoring. By establishing clear metric baselines, defining relative thresholds, and automating rollback with tools like Flagger or Argo Rollouts, you transform canary releases from anxiety-inducing processes into systematic, data-driven delivery.
Related guides: Canary Deployment Basics | Shadow Deployments
From the team at Nife
Deploy your next app in minutes, not days.
Nife is a multi-cloud edge platform that lets you deploy, scale, and manage applications globally without the infrastructure headache.